I pulled every cut point file CMS has published since the Part D adherence measures entered the ratings in 2012, and matched them against contract-level scores going back to 2014.
Two numbers from that pile tell you most of what's coming. Since 2014, the average Medicare drug plan raised its statin adherence rate from 71% to 89%. Over the same stretch, the average star on that measure fell from 3.6 to 3.2.
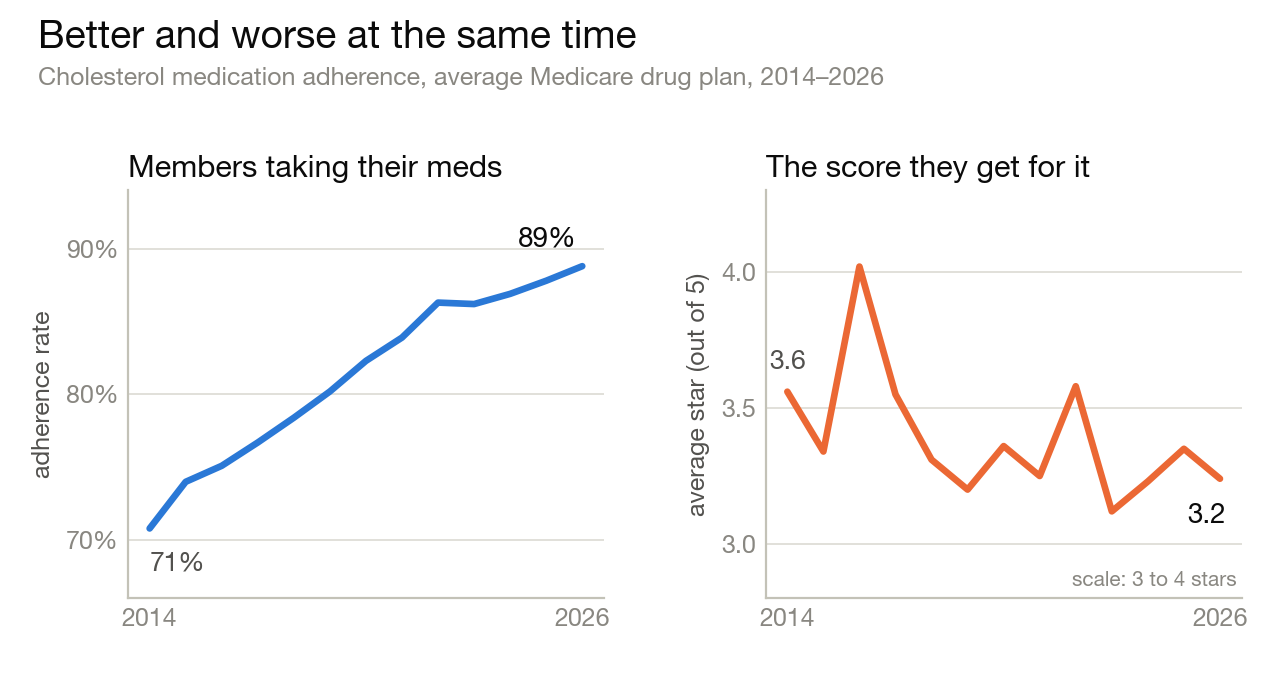
Plans got much better, and the scoreboard says they got worse. If you run Stars or pharmacy at a plan, you already live inside that contradiction. What's less visible is that the scale underneath is about to be replaced, and almost nobody has looked at how the replacement behaves.
Graded on a curve
CMS recalculates the star cut points every year from that year's contract scores: clustering, with an outlier trim and a cap on how far any bar can move in one year. There's no fixed standard underneath. When everyone improves, the bar climbs to match, and the stars get handed out across whatever range is left.
Fifteen years of that produces strange arithmetic. A plan holding 76% statin adherence was 5-star in 2012; that same rate today is 1-star, because anything under 84% now lands in the bottom band. And it gets stranger the harder you push:
- Score the whole 2014 field of Medicare Advantage drug plans against the 2026 cut points, and 91% to 98% of contracts land at 1 star, depending on the measure.
- Score 2026 against the 2014 bars, and nearly every contract is 5-star.
That much improvement is a real clinical win, and I don't want to talk past that. Some of it is also how the measure is built: the denominator has never included everyone (members must fill a prescription at least twice, and insulin users have always been out), and CMS has since carved out hospice and end-stage renal disease and tightened the enrollment rules. But however you split the credit, the competitive result is the same. The curve ate the improvement.
Nine points wide
What the curve leaves behind is a tighter scale. In 2014, the distance from the bottom band to the 5-star bar on diabetes adherence was exactly ten percentage points. The 2026 ratings put it at nine points on all three measures (diabetes, blood pressure, and cholesterol meds) for Medicare Advantage drug plans, and as narrow as five for standalone plans. For the Medicare Advantage plans, the diabetes cut points sit at 83, 86, 89, and 92.
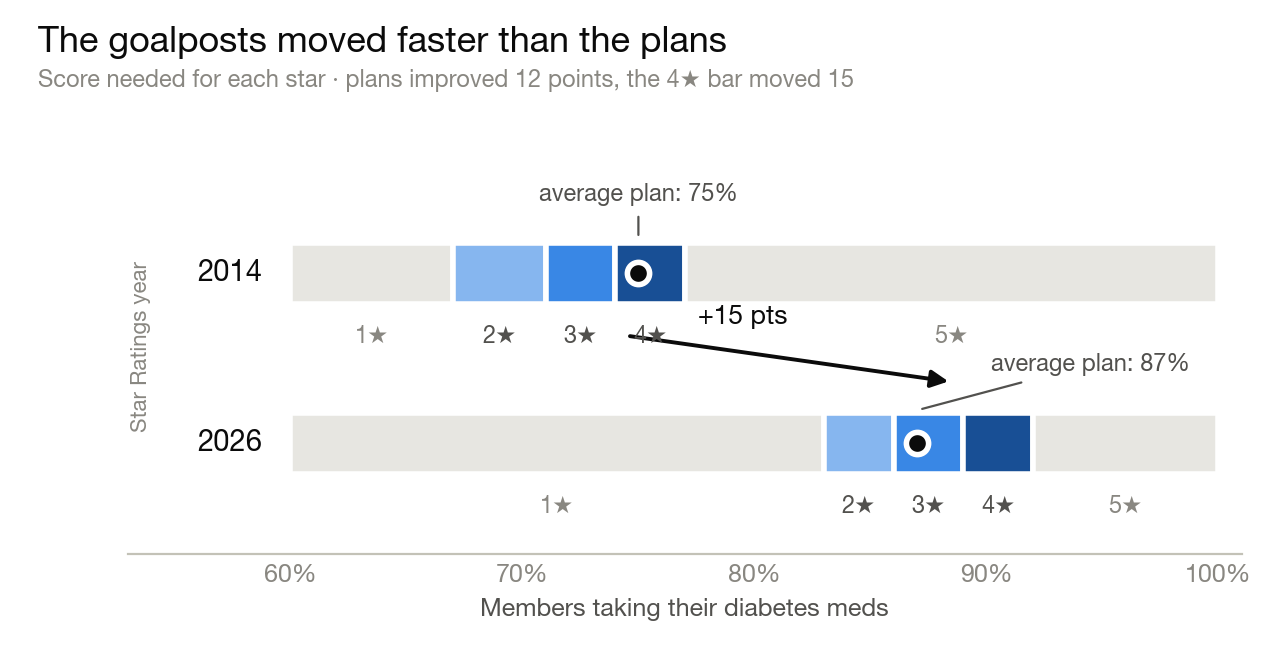
At that spacing, one percentage point decides the star. I tested it directly, moving every plan's 2026 rate up or down by a single point:
- 64% to 70% of Medicare Advantage drug plans change stars, depending on the measure.
- For standalone plans it's 93% to 95%.
- On the standalone blood pressure scale, one point is the entire distance between 3 stars and 4.
Put that in member terms. A 100,000-member plan might have 20,000 to 25,000 members in the diabetes denominator after the carve-outs, so one point is 200 to 250 specific people crossing 80% of days covered. That's a list of names with an owner for each one, which is a different job than running a campaign.
That's the scale as it stands today. It has exactly one year left.
2027: the last normal year
The ratings arriving this October, the 2027 Star Ratings, are the final ones on the old scale, and they double as the largest natural experiment Part D has ever run. They score adherence over calendar 2025, the first year under the $2,000 out-of-pocket cap.
History says the cap should move adherence. The last time Part D had a hard cost cliff, the donut hole, beneficiaries with no gap coverage were 57% more likely to abandon their cardiovascular medications. If putting that cliff there pushed people off their drugs, taking it away should pull some of them back. Early studies of the 2024 changes point the same way: cost-related nonadherence fell about five percentage points compared with people on private insurance, and nearly eight among people with multiple chronic conditions.
There's a catch in that comparison. Those studies measure what people say about affording their medications, while the star measure counts what pharmacies actually dispense. If October's numbers jump, cost was what was holding people back all along. If they don't, then most of what remains is a follow-up problem that no benefit design can reach.
Either way, October is the closing reading on a scale that's about to be retired. What replaces it arrives in two steps.
2028: the quiet year of risk adjustment
Starting with the 2028 Star Ratings, the three adherence measures become risk-adjusted for age, sex, low-income subsidy and dual status, and disability. A change that big makes them "new" measures in CMS's rulebook, and new measures enter at weight 1.
So for exactly one rating year, the measures that defined a decade of Part D strategy will count for roughly 4% of a Medicare Advantage drug plan's overall rating, down from about 11% today. Then the weight snaps back. Two things make that one-year dip worth planning around:
- The measurement year for 2028 is calendar 2026, which is running right now. Every fill your members complete this month is being scored against a scale you have no benchmark for.
- You don't need to guess how that scale behaves, because CMS already publishes risk-adjusted versions of all three measures on its display page. I matched them against the unadjusted versions for every contract CMS scores on both, then split the results by CMS's own social-risk categories.
The results don't match what the industry expects.
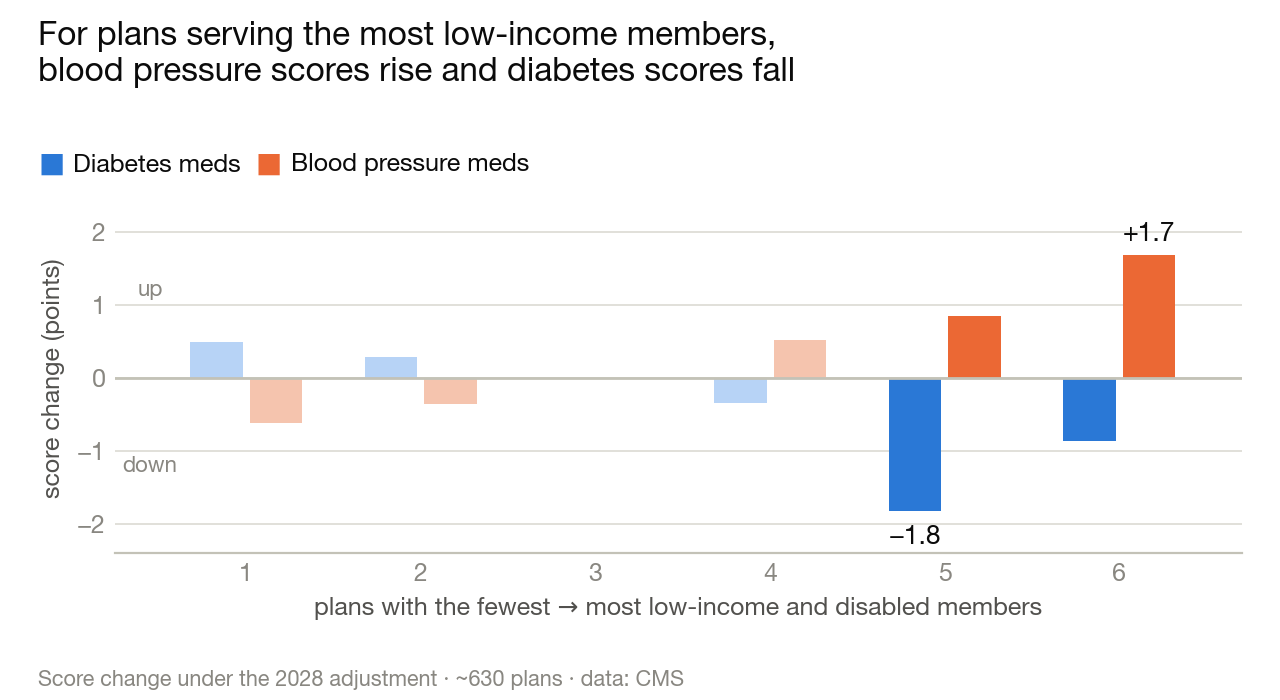
- On blood pressure meds, adjustment does what everyone expects: the highest social-risk contracts gain 1.7 points on average, and 96% of them improve.
- On statins, more than half of all contracts score lower after adjustment, and just 11% score higher.
- Diabetes runs backwards. Plans in the top dual and disability categories lose ground, with the second-highest category down 1.8 points on average, while the lowest-risk plans gain.
CMS's own model for Medicare Advantage drug plans shows why: the low-income and dual-eligibility factor adds points on diabetes and takes them away on the other two.
Researchers urged CMS to consider this kind of adjustment back in 2014, when a Health Affairs study found that more than a third of the difference in adherence scores between plans came down to socioeconomics. Fourteen years later it finally arrives, and on the diabetes measure it moves the wrong way. If you run a dual special needs plan or a heavy low-income-subsidy book, "risk adjustment will finally give us credit" is half right. The half that's wrong is your diabetes measure.
2029: the trap
CMS wrote the weight sequence down in April 2024, in the CY2025 final rule:
"The first year (2028 Star Ratings) the updated medication adherence measures will be in the Star Ratings they will have a weight of 1, but then beginning with the following Star Ratings year, the weight will increase to 3, as these measures are categorized as intermediate outcome measures."
The part nobody quotes sits in the technical notes. Guardrails normally stop a cut point from moving more than five points in a year. Guardrails don't apply to new measures for their first three years, and respecified measures count as new.
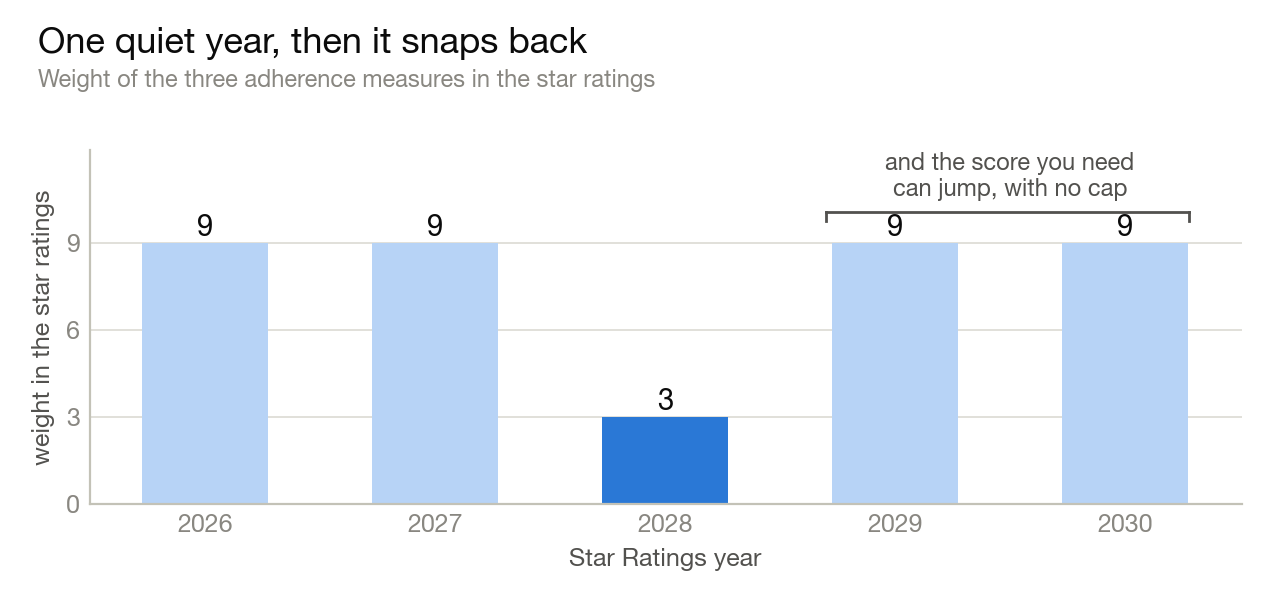
Put those together and 2029 looks like this:
Add it up and forty percent of the Part D summary rating rides on cut points that can go anywhere, because the 2029 measure list shrinks around the adherence trio.
If that sounds theoretical, it has a price history. The last time CMS changed the cut point math, the Tukey outlier change for 2024, SCAN lost roughly $250 million on a single year's scores and had to win it back in court. And that was in a year the five-point cap was officially in force; it just ran in the wrong order. Humana's ongoing fight over three test phone calls is worth roughly $3 billion by one analyst's estimate. A moving bar costs real money.
The industry is planning for 2028. The weight and the missing guardrails both land in 2029.
What I'd do between now and October
- Run the risk-adjusted spec against your own claims. The medication lists and adjustment fields are public. Two years of your own baseline before the weight comes back is an advantage nobody can sell you later.
- Check the display page for your own contract. Your contract's risk-adjusted rates are already published, one file over from your star rates. They tell you, measure by measure, whether 2028 helps you or hurts you.
- Count the members sitting just under 80% of days covered. They are the ones who move your rate a point, and that count tells you more about your risk than your overall rate does. For a big contract it's a few hundred people; for a mid-sized one it's a few dozen.
- Spend 2028 on the changes you've been putting off. It's the cheapest year in a decade to rework outreach models, vendor contracts, and pharmacy partnerships, because a stumble costs a third of what it will cost a year later.
- Hold October's release against your own projection. The gap between what you predicted and what CMS publishes tells you how well you actually know your own book.
The middle of that list is where software actually helps. Predicting which members will end the year under 80% of days covered is not a hard problem if you have fill data, and AI has made it close to commodity. What actually separates plans is duller: whether a specific person owns each of the couple hundred names the model turns up every month, and whether those get worked in days instead of quarters. The predicting got cheap, and the follow-through never did.
A curve can tell you who's ahead. It can't tell you whether anyone is getting healthier, and for fifteen years Part D adherence was asked to do both jobs at once. For the next three rating cycles it won't reliably do either. The plans that come out of the reset ahead will be the ones who knew their own numbers before CMS told them, whatever their rates looked like in 2026.
Sources and methodology
- CMS: 2026 Star Ratings data tables, including the Part D cut points (Oct 8, 2025)
- CMS: Part C and D Performance Data archive, 2012–2026 Star Ratings and cut point files
- CMS: 2026 Medicare Advantage and Part D Star Ratings Fact Sheet (Nov 18, 2025), Tables 8–9
- CMS: 2026 Part C & D Star Ratings Technical Notes: measure specs, Tukey and guardrail methodology (Attachment K), adherence math (Attachment L)
- CMS: 2026 Display Measures: risk-adjusted adherence (DMD17–DMD19), PQA value sets, display technical notes
- CMS: 2027 Star Ratings Measures and Weights (2028 and 2029 shares projected on the 2027 measure set as amended by the CY2027 final rule)
- CY2025 Medicare Advantage and Part D final rule, 89 FR 30448 (Apr 23, 2024)
- CY2027 final rule, 91 FR 17384 (Apr 6, 2026)
- Polinski et al., "Beneficiaries with Cardiovascular Disease and the Part D Coverage Gap," Circulation: Cardiovascular Quality and Outcomes, 2012 (CVS Caremark / Brigham and Women's / Harvard; 122,000+ beneficiaries)
- AJMC: IRA drug provisions linked to a significant drop in Medicare medication nonadherence (Aug 2026), summarizing the JAMA Internal Medicine difference-in-differences analysis and its JACC companion
- Fierce Healthcare: socioeconomic traits impact Part D performance ratings, summarizing the Jan 2014 Health Affairs study
- Milliman, "Recalculating Medicare Advantage: Potential SCAN and Elevance Ruling Implications"; star ratings litigation coverage, Fierce Healthcare, 2024–2026; Capstone estimates
Analysis of contract-level rates, cut points, and display measures is my own, computed from the public CMS files above. Contract figures are unweighted averages across rated contracts. CMS publishes both the adjusted and unadjusted rates as whole percentages, so a third to four in ten contracts show no shift at all; the direction of the pattern is robust, individual shifts of a point are not. The one-point star test in the compression section uses those same rounded rates.